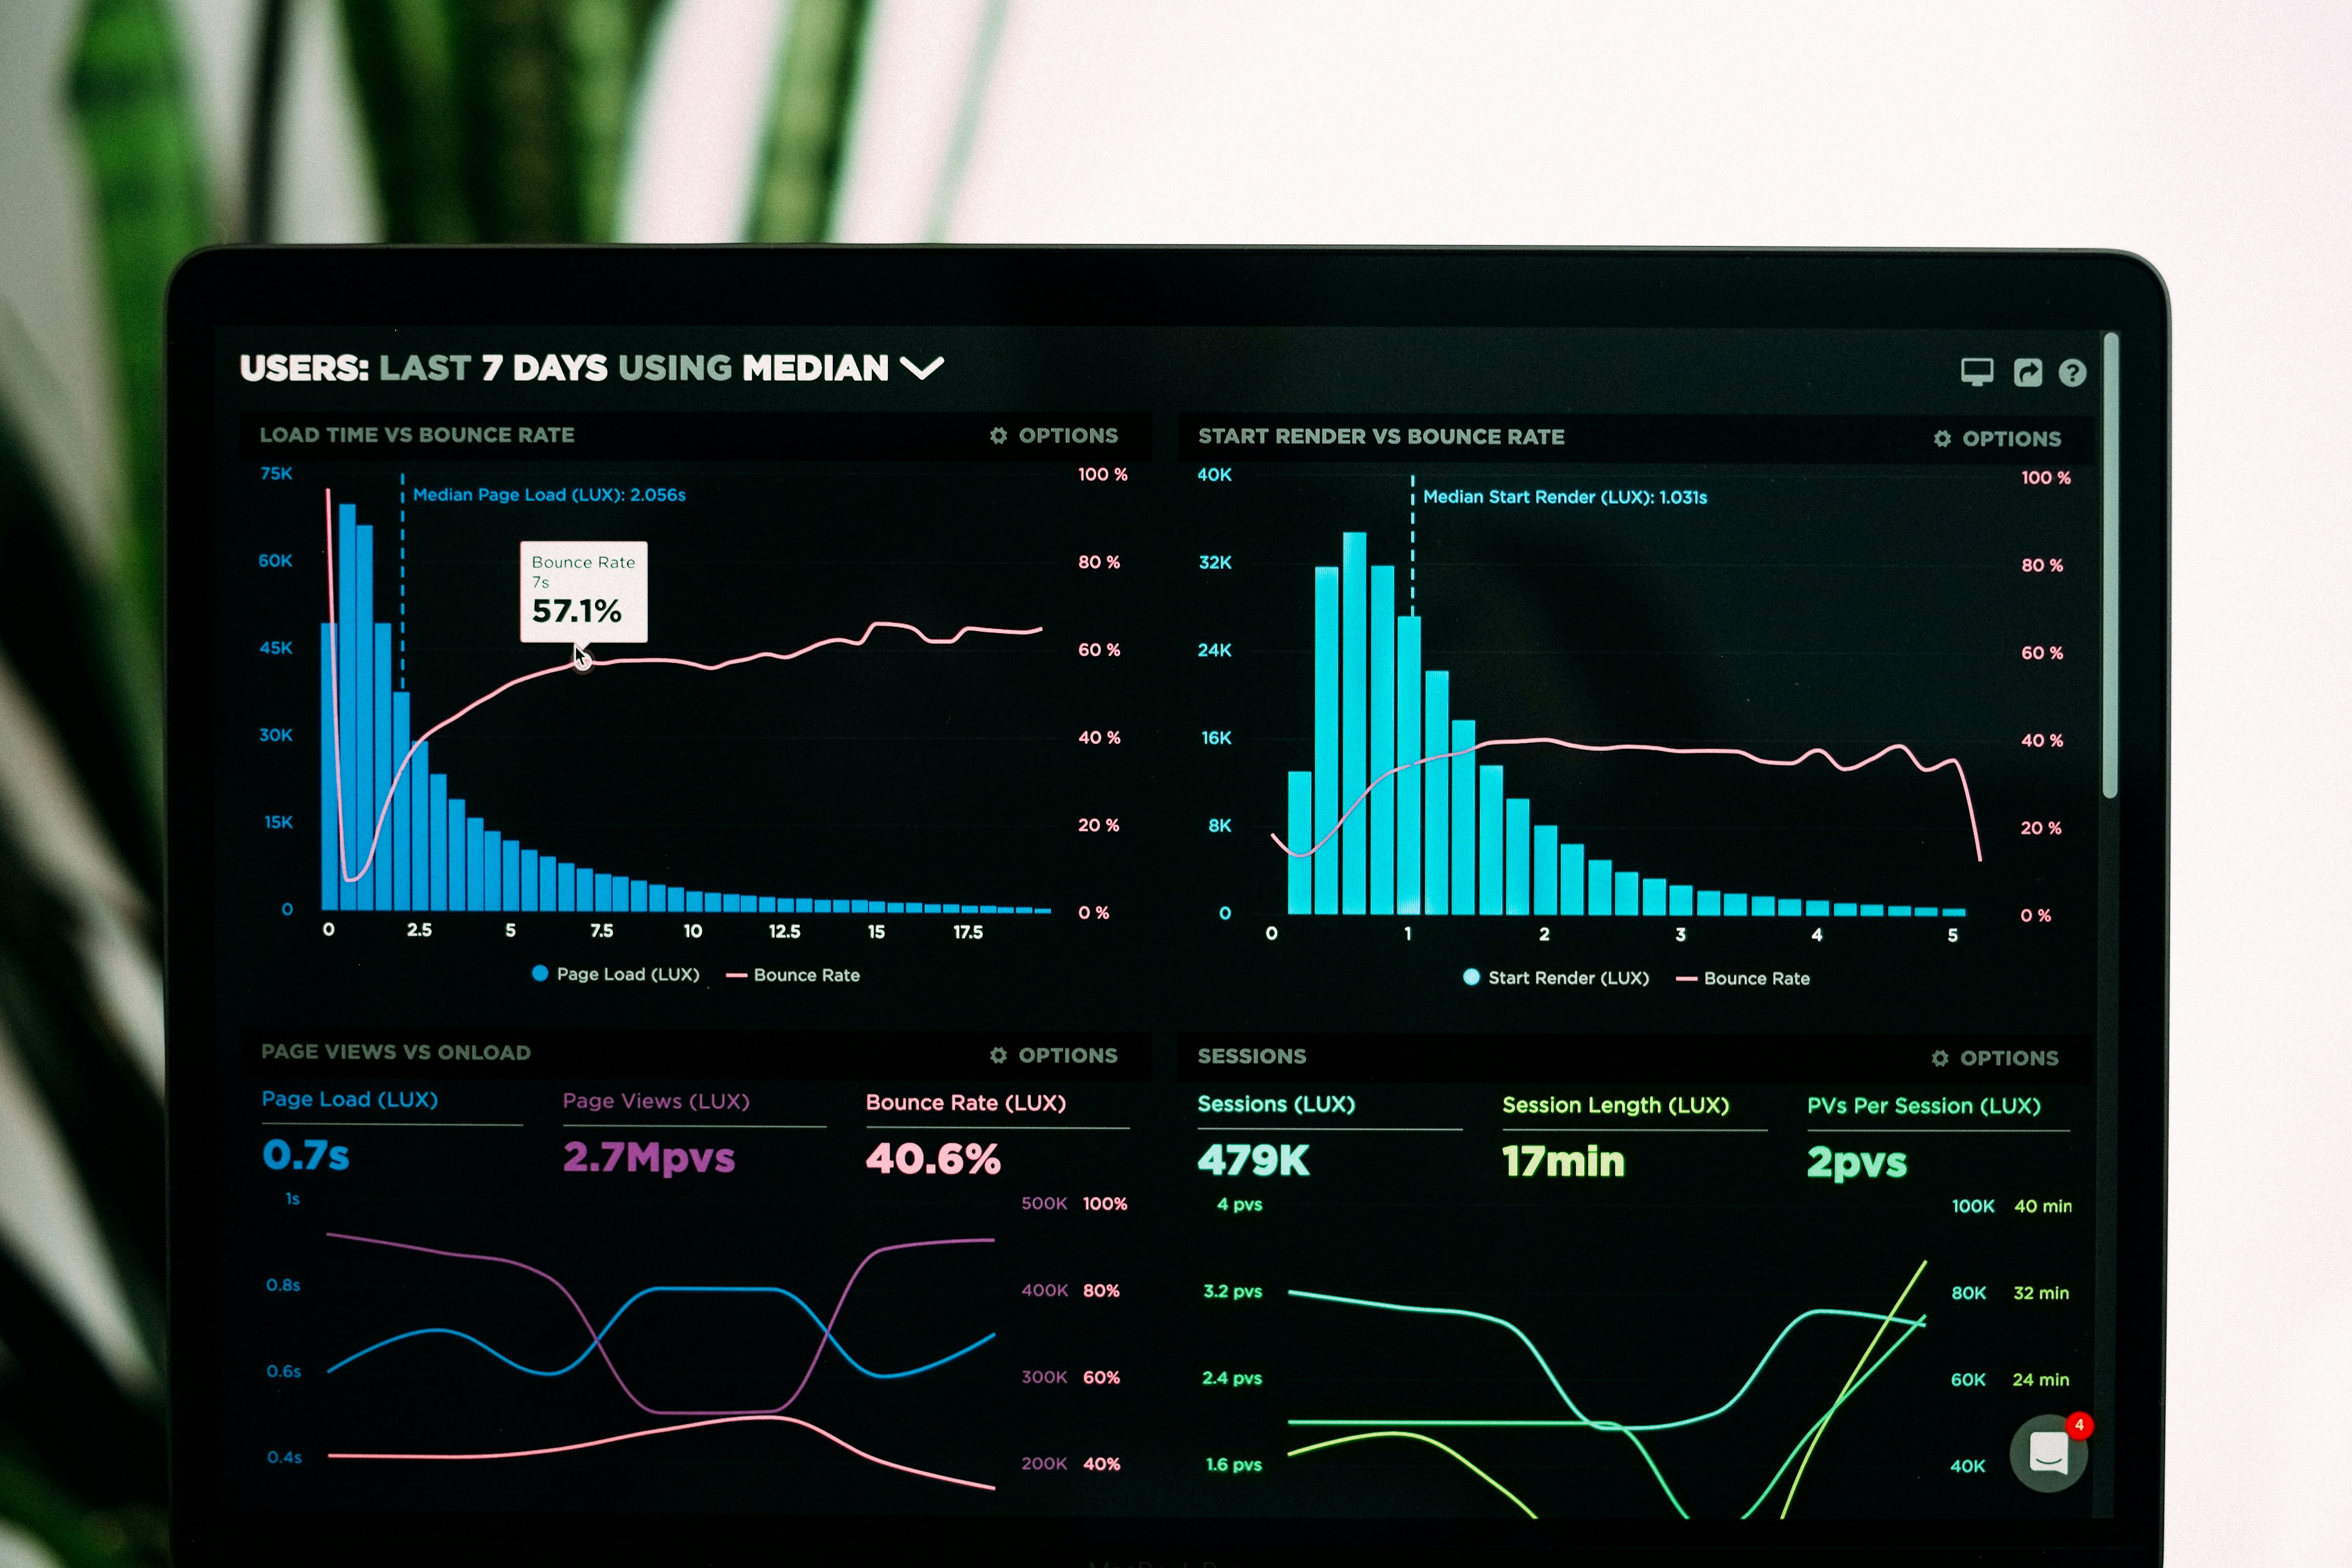
Hello! I'm Wambui, a Data Scientist driven by curiosity and a commitment to continuous learning.I leverage tools such as Python, SQL,and Machine learning Techniques to craft powerful visualizations and solve complex business problems. I am passionate about turning data into actionable insights and aim to contribute meaningfully to society through innovative solutions
These projects showcase my ability to work on real-world data problems, leveraging tools such as Python, SQL, and Tableau, as part of my training at Moringa School.
Objective: Developed a natural language processing (NLP) model that classifies Reddit posts as either depressive or non-depressive.
Technologies Used: Python (NLTK, Scikit-learn), Data Visualization (Matplotlib, Seaborn), HTML/CSS, Streamlit
Features:
Outcome: Achieved 90% accuracy, showcasing linguistic markers of depressive tendencies.
View ProjectObjective: Performed sentiment analysis on tweets related to Apple and Google products, classifying user sentiments into positive, negative, or neutral categories using Natural Language Processing (NLP) techniques. The goal is to assess public perception of these brands based on social media data.
Technologies Used:
Outcome: Based on the analysis, the SVM model is recommended for production use due to its superior overall accuracy and handling of neutral sentiment
View ProjectObjective: Developed models to predict customer churn, enabling proactive retention strategies.
Technologies Used:Programming Languages: Python Libraries/Tools: Pandas, Matplotlib, Seaborn, Scikit-learn Techniques: Logistic Regression, Decision Trees, Exploratory Data Analysis (EDA), Data Cleaning
Outcome: Achieved 82% model accuracy and identified key churn predictors, improving retention by 25%.
View ProjectObjective: Predict home values in King County based on multiple features, such as size, location, and property age, to provide actionable insights into the real estate market.
Technologies Used:
Outcome: Achieved high model accuracy, enabling practical use for real estate investors and stakeholders.
View ProjectObjective:Analyze the Box Office Mojo and IMDB datasets to identify movie genres that perform well at the box office, providing actionable recommendations for investment and studio collaborations to increase box office success.
Technologies Used:
Outcome: Provided actionable recommendations for investment in high-performing genres and strategic collaboration with leading studios to maximize box office success.
View ProjectThese self-initiated projects demonstrate my ability to independently explore and solve complex problems while sharpening my technical skills.
Objective:To understand the characteristics of those who survived to provide more insights for improving survival rates in analogous scenarios
Technologies Used:
Outcome:I managed to predict Titanic survival correctly for 72% of people -as per this Kaggle competition results.
View ProjectObjective: To analyze sales data and customer purchasing behavior to provide business insights that improve decision-making.
Technologies Used:
Outcome: The project identified best-selling products, peak sales periods, and segmented customers based on purchasing behavior. The insights support inventory planning and targeted marketing strategies.
View ProjectObjective: To analyze Inside Airbnb data and to come up with business insights and powerful visualizations
Technologies Used:
Outcome:In progress.
View ProjectThese Power BI projects demonstrate my ability to turn data into actionable insights through interactive dashboards. Using DAX and visualization techniques, I create clear, data-driven stories for better decision-making.
Objective: This Power BI dashboard enhances my Python-based sales analysis by providing interactive visualizations that simplify trend tracking and product performance monitoring.
Tech Stack:
Key Insights & Visuals:
Outcome: Power BI made data storytelling more efficient, offering a dynamic and user-friendly way for stakeholders to explore business performance.
Download ReportObjective: This Power BI dashboard provides key insights into Airbnb listings, pricing trends, and booking patterns. It enhances my Python-based data analysis by delivering interactive visualizations that make market trends and business insights easily accessible.
Tech Stack:
Key Insights & Visuals:
Outcome: By integrating Power BI, I enhanced my ability to present Airbnb market trends interactively. This dashboard enables users to explore pricing patterns, identify competitive locations, and make data-driven business decisions.
Download ReportGet more details about my experience and projects on my CV.
CVYou can reach me through email or any of these platforms.